Profiling
Using Rsdoctor
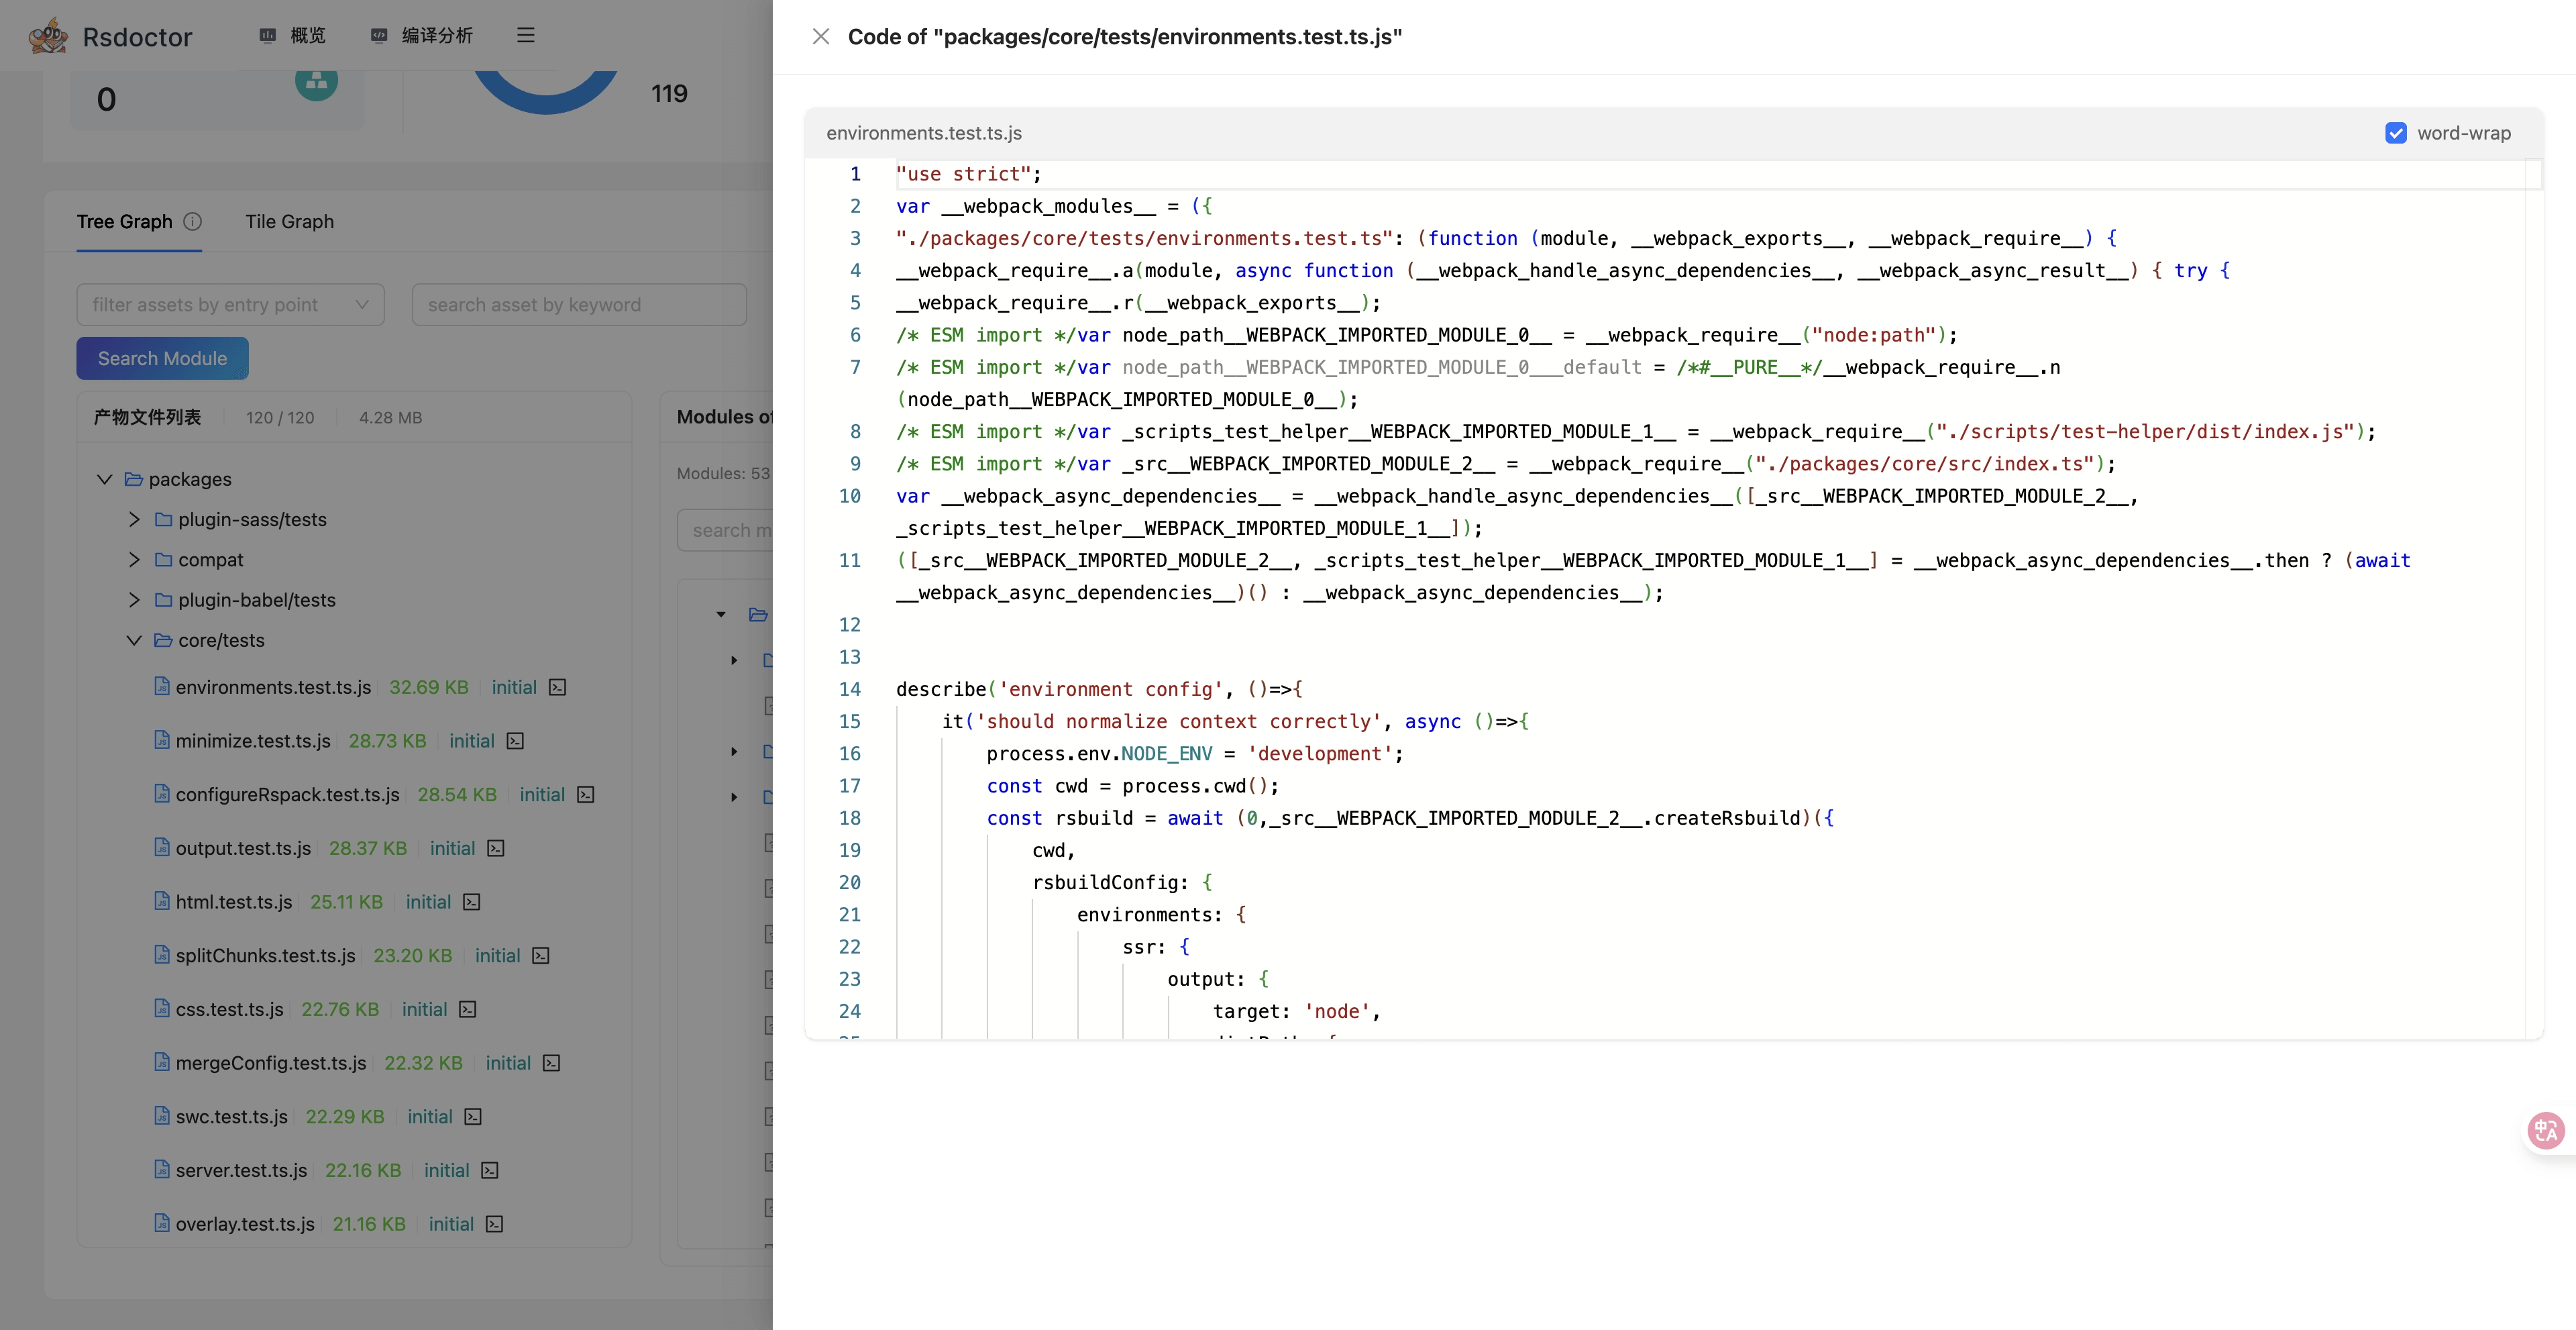
Rsdoctor is a build analysis tool that can visually display the compilation time of each loaders and plugins.
When you need to debug Rstest's build outputs or build processes, you can use Rsdoctor for troubleshooting.
Quick start
In Rstest, you can enable Rsdoctor analysis as follows:
- Install the Rsdoctor plugin:
- Add
RSDOCTOR=trueenv variable before the CLI command:
As Windows does not support the above usage, you can also use cross-env to set environment variables. This ensures compatibility across different systems:
After running the above commands, Rstest will automatically register the Rsdoctor plugin, and after the build is completed, it will open the build analysis page. For complete features, please refer to Rsdoctor document.
CPU profiling
Samply
Note: In order to be able to profiling the Node.js side code in macOS, Node.js v22.16+ is required.
Samply supports performance analysis for both Rstest main process and test process simultaneously. You can perform a complete performance analysis through the following steps:
Run the following command to start performance analysis::
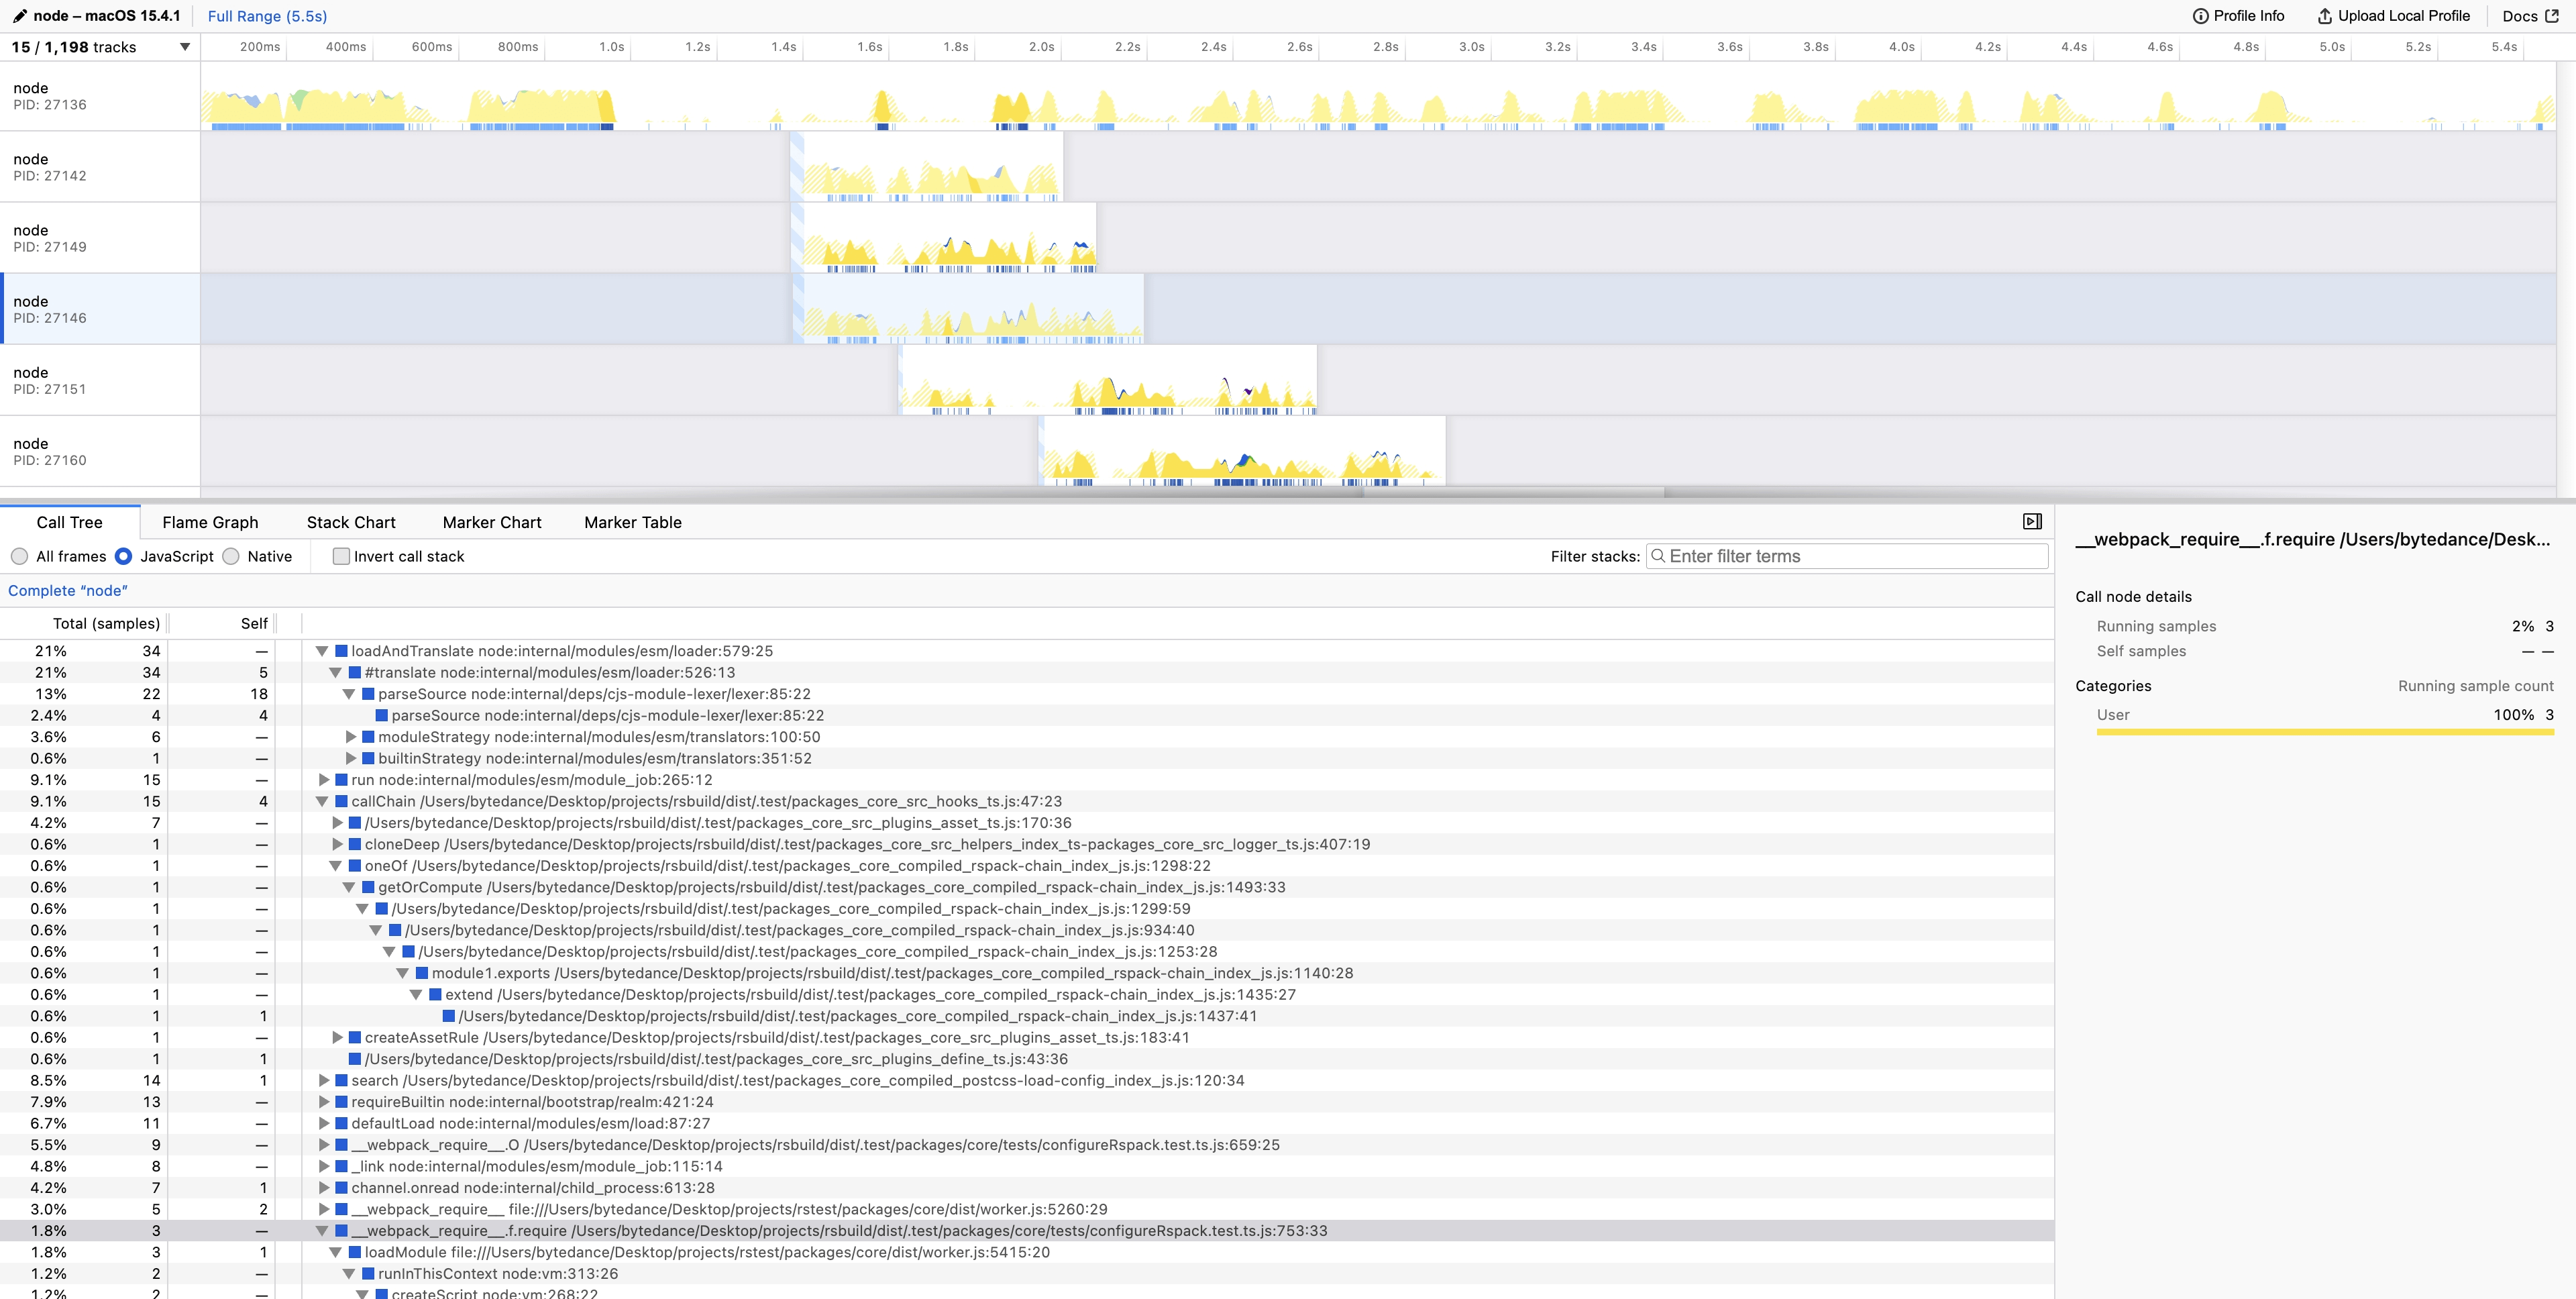
After the command execution, the analysis results will automatically open in the Firefox Profiler.
Rstest’s JavaScript typically runs in the Node.js thread. Select the Node.js thread to view the time distribution on the Node.js side.